Overview
| Site: | eCarleton |
| Course: | R for Biologists |
| Book: | Overview |
| Printed by: | Guest user |
| Date: | Tuesday, 30 April 2024, 12:09 PM |
Description
Click here for an overview of the modules offered in this online course.

R is a free (open source) object-oriented programming language and software environment for statistical computing and graphics that is rapidly becoming the lingua franca of researchers in many disciplines. As the single most important tool for statistics, visualization and data science in the world, students with training in R are increasingly sought after by academia and industry.
This is a suite of online resources designed to help introduce R programming for those who want to use it for:
a) Data handling
b) Statistics and
c) Modelling
Each of the above modules are further broken down into 10-12 stand alone components which concentrate on a specific aspect of R programming. The resources provided are not designed to replace face-to-face teaching, but to complement it by introducing the theory (typically, videos of powerpoint presentations), the practice (typically, videos of writing code in RStudio) and the code (developed using RMarkdown/knitR) associated with a particular concept or approach. Short multiple choice exercises are provided at the end of each component, while longer multi-choice exams are available to fully test your understanding.
Upon successful completion of R LABS (3 modules), students will be able to:
Learning to program any computer language necessarily encourages both critical thinking and problem solving. Therefore students completing the three modules will have the grounding and confidence necessary in R programming to adapt and develop their own tailor made applications.
Enjoy!
![]()
RStudio is an Integrated Development Environment (IDE) that facilitates R programming in making import of data and the search for help much easier. Moreover RStudio highlights variable properties in one window (such as how many elements it has, and their sizes) and colour-coding of code make the R code itself more transparent and readable. We wondered whether we should go for the default IDE for R, but after a few years teaching R programming to students it was clear that they all found RStudio helpful in the learning process.
![]()
R Markdown is a variant of Markdown in which R code is embeded in chunks within text and graphics. Using knitR within RStudio we can turn these annotated scripts into lovely looking html (or Word, or pdf) pages. Since all graphs, computations and statistics are computed at the same time that the text is typeset, then everything is exactly reproducible. Not only does it look great, but it allows authors to re-do everything should the underlying data change (for example). Students will NOT be able to run the R code directly from the html (since its in html), but they will know that using this code then the results are almost guaranteed to be reproducible (the only proviso being that if one is doing something rather complex and the package or version of R has a different algorithm).
Data handling
Almost all scientists collect data of some sort or another and must manipulate it, summarize it and visualize it in meaningful ways. This module begins with an introduction to the different types of variables in R and how to manipulate them. It also teaches you how to read and write data files in R, how to extract information from data and how to visualize their properties.
Statistics
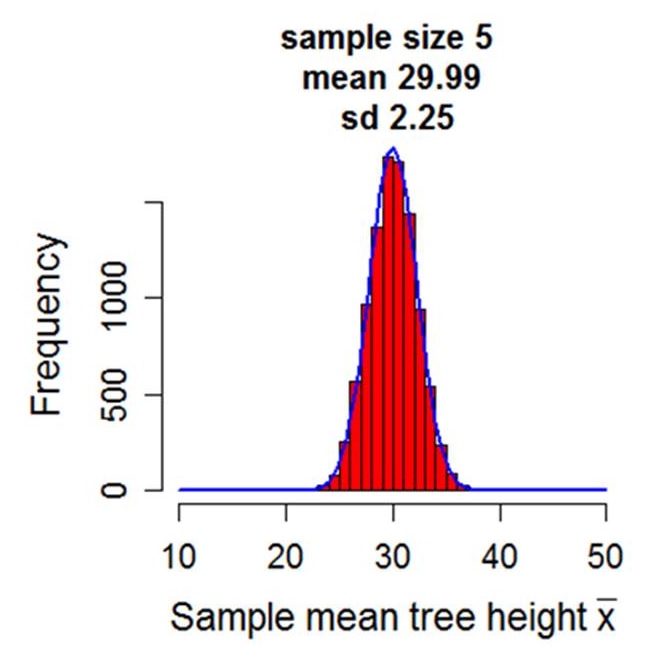
Statistics is the science of drawing inferences about populations from samples. For example if we wish to test the hypothesis that males and females differ in population mean height, we might take a sample of male and female heights and using what we know about the sample means and how heights vary, evaluate the strength of evidence for this hypothesis.
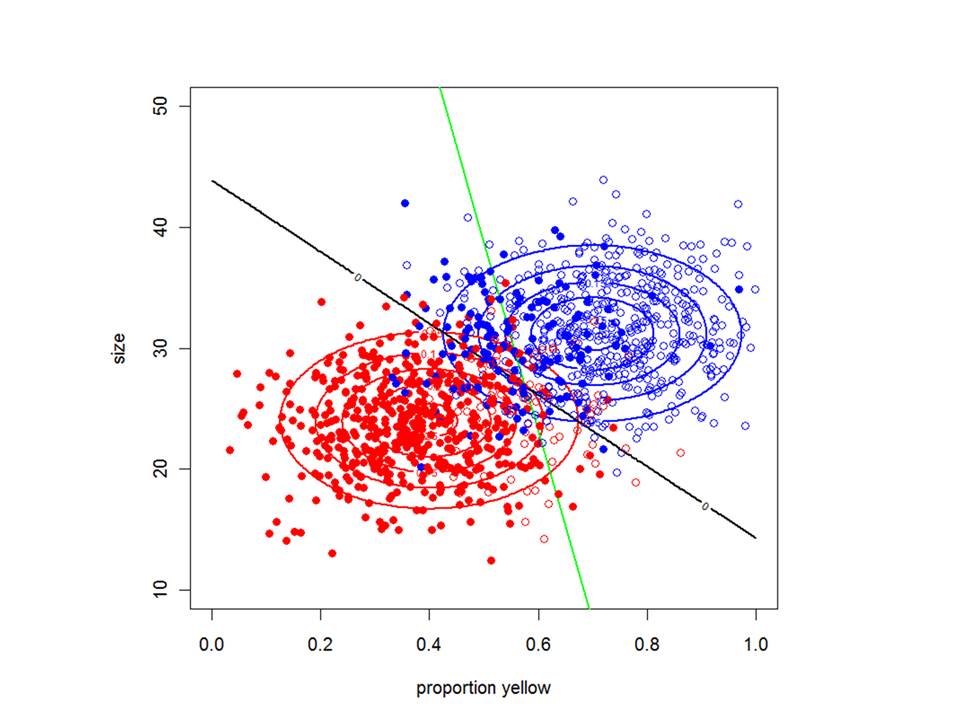
The module presented here explains how to conduct a range of null hypothesis significance tests (NHST) using R, including analysis of variance, linear regression and analysis of covariance. NHSTs form the backbone of the frequentist method and essentially attempt to derive the probability of obtaining the test statistic or a more extreme if the null hypothesis was true. Our primary unifying framework will be the General Linear Model (GLM). Although not all frequentist statistics are GLMs, many of the more familiar are, and they share the same underlying assumptions and philosophy.
Modelling

As a programming language, R can be used to simulate processes just as you can with other programming language. For example, there are packages you can install which allow numerical integration of rate equations so you can explore continuous time models. R is also particularly adept at dealing with matrices, so it is easy to develop matrix population models. While R is not as quick in execution as other programming languages such as C++, the range of add-on packages make it a useful tool for developing, exploring and visualizing simple models.
Why learn statistics (and R)?
With the birth of "big data", statistics is a rapidly growing profession, and R is amongst the most popular programming environments for statistical analysis. Lets not forget about "small data" that we all know and love either, because its even more challenging to draw inferences about populations when our sample sizes are low. Statisticians are widely employed in industry, government and academia and its a cool job visuaiziing patterns and testing hypotheses. The following video from the American Statistical Association says it all.